Aircraft Spruce & Specialty Co.

- Photo may represent series and not specific product
- SHARE


JPI EDM-930 Primary Certified Engine Monitor


| Description | PN | Price | Buy |
|---|---|---|---|
| JPI EDM-930 (4) Cylinder Primary STC No Tank System | 10-04909 | $6814.00 | |
| JPI EDM-930 (4) Cylinder Primary STC 2 Tank System | 10-02111 | $7044.00 | |
| JPI EDM-930 (4) Cylinder Primary STC 4 Tank System | 10-04731 | $7274.00 | |
| JPI EDM-930 (6) Cylinder Primary STC No Tank System | 10-04911 | $7125.00 | |
| JPI EDM-930 (6) Cylinder Primary STC 2 Tank System | 10-02112 | $7389.00 | |
| JPI EDM-930 (6) Cylinder Primary STC 4 Tank System | 10-04732 | $7601.00 | |
| JPI EDM-930 (7) Cylinder Primary STC | 10-02632 | $7435.00 | |
| JPI EDM-930 (8) Cylinder Primary STC | 10-02633 | $7572.00 | |
| JPI EDM-930 (9) Cylinder Primary STC | 10-02634 | $8119.00 |
Overview
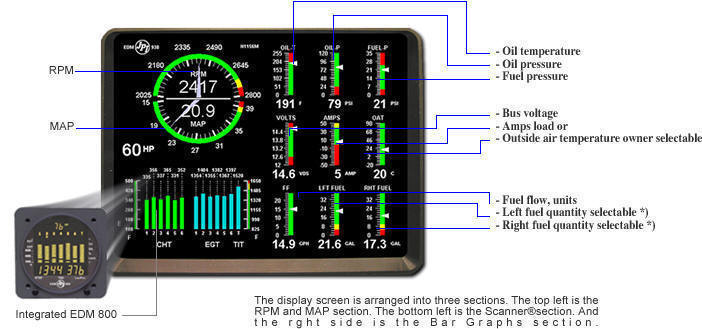
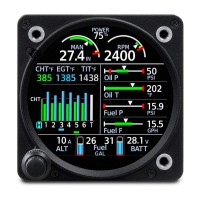
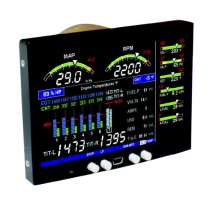
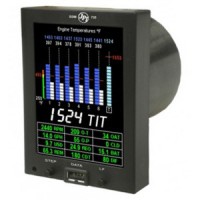
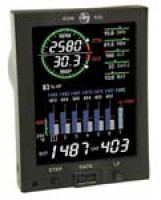
| Required Order Form Think of your EDM-930 as your personal flight engineer. Always there, working in the background, constantly watching over your engine while you concentrate on flying the aircraft. Your EDM-930 will be monitoring your engine conditions four times per second and will warn you instantly if any measurement exceeds the programmed limit. Analog Display Bar Graphs Section Display - Oil temperature
The Normalize view permits rapid visualization of EGT trends, rather than a percentage of red line. The missing segment in the column represents the cylinder head temperature. Above each column is a number corresponding to the engine cylinder number. The rightmost column displays turbine inlet temperature. Beneath the bar graph is the alphanumeric display. A single index dot above one column indicates which cylinder is being displayed on this numerical display. When the index dot is beneath a cylinder number, 1 through 6, the digital display shows the EGT on the left four digits and the CHT on the right three digits. Two other derived measurements are shown in this display: The difference between the hottest and coolest exhaust gas temperatures. EGT EGT is shown on the first four or six Scanner bar graph columns. These are labeled 1 through 4 or 1 through 6 above the columns. The lower limit of the graph range represents half of the TIT alarm red line (default is 825°F) and the top of the range represents alarm red line (default 1650°F). The numerical value of the EGT is shown on the left side of the digital display for each cylinder when there is a dot under one of the cylinder numbers above the columncylinder 2 in this example. There are two views: Normalize view levels the EGT columns and increases the sensitivity of the Scanner bar graph columns to 10° per segment. To enter the Normalize view, hold the LeanFind button for three seconds. The NRM icon will be displayed above the Scanner section. Hold the LeanFind button for three seconds to return to the Percentage view. CHT TIT |
| As the mixture is leaned, EGT rises to a peak temperature, and then drops as the mixture is further leaned. Peak power occurs at a mixture using more fuel than at peak EGT. Best economy occurs at peak EGT. Accurate leaning yields optimal engine temperatures. By being able to precisely adjust the mixture, your engine can produce either the best fuel economy or maximum power, whichever you choose. |
| As the mixture is leaned, EGT rises to a peak temperature, and then drops as the mixture is further leaned. Peak power occurs at a mixture using more fuel than at peak EGT. Best economy occurs at peak EGT. Accurate leaning yields optimal engine temperatures. By being able to precisely adjust the mixture, your engine can produce either the best fuel economy or maximum power, whichever you choose. |
|
So how do I use the Lean Find Mode?
Upon reaching cruise configuration, you can use the LeanFind mode to identify the first cylinder to reach peak EGT. Note that this is the leanest cylinder, not necessarily the hottest cylinder. You begin the leaning process by pre-leaning the mixture to about 50 degrees below the estimated peak on any one of the cylinders. For example, lets say that you have determined that 1350 is the pre-lean value for your aircraft. Now wait about 30 seconds for temperatures to stabilize. You can enter the LeanFind mode by simply tapping the LeanFind button. You will then see the exhaust gas temperature of the hottest cylinder on the left display. Now you slowly lean the mixture at a rate of about 5 degrees per second. When there is a 15° rise in EGT, the Lean Find will become active, indicated by the flashing cylinder number of the hottest cylinder. If you have the fuel flow option, the fuel flow rate will be shown on the right display. Stop leaning when the column begins flashing. You will see PEAK EGT on the display, followed by the value of the exhaust gas temperature of the first cylinder to peak.. In most cases you will now be on the lean side of peak by about 10 degrees. While the column is flashing, slowly enrich the mixture. The temperature will increase, returning to peak. Stop enriching at the desired exhaust gas temperature, usually peak to 20 degrees rich of peak for best economy. |
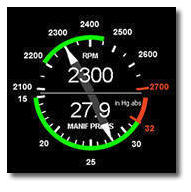 The upper semicircular bar graph shows the RPM (Revolutions per Minute) and the lower semicircular bar graph shows the MAP (Manifold Pressure). These are shown both graphically and digitally. Power settings entering red line are displayed by flashing the ALERT icon and flashing message on the bottom left scanner section of the screen. Percent horsepower is displayed digitally underneath the MAP arc
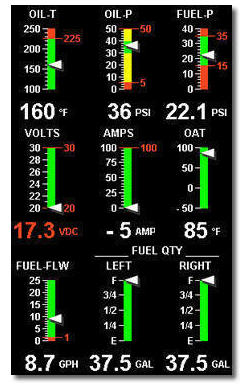 The Bar Graphs section contains nine dedicated 12 segment bar graphs with digital display. The default displays are (left to right, top to bottom):
 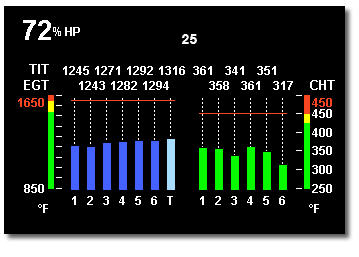 Lets examine the scanner section analog display. Central to the display is the exhaust gas temperature or EGT bar graph presentation. The height of each column represents the EGT. The last column shows turbine inlet temperature. The range of the EGT columns is red line at the top down to one half of red line at the bottom. This is called the percentage view because you are looking at a percentage of red line. The Normalize view allows you to see small, subtle changes in temperature. When you change to the Normalize viewhold the Lean Find button for three seconds all column heights are set to the identical half-height. Any changes are shown as an increase or decrease in column height. A one-bar change in column height represents a 10 degrees change.
 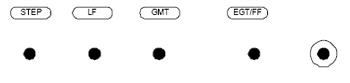 There are four buttons on the front panel. From left to right they are the STEP button, the Lean Find button, the GMT button, and the EGT fuel flow button. Ten minutes after the EDM-900 is turned on, it will automatically index through all measurements.
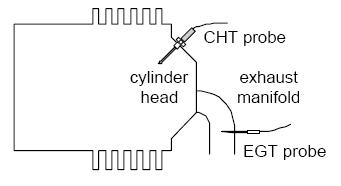 In a piston engine only a small portion of the energy from combustion produces movement of the piston during the power stroke. The majority of energy passes into the exhaust pipe as hot gasses. By monitoring the temperature of these exhaust gasses you will have an indication of the quality of the combustion process. Low compression, non-uniform fuel distribution, faulty ignition, and clogged injectors diminish the efficiency of the combustion process that generates power. From the cockpit you can adjust the fuel/air ratio by a process called leaning. Retarding the mixture control changes the fuel/air ratio and hence the resulting Exhaust Gas Temperature (EGT).
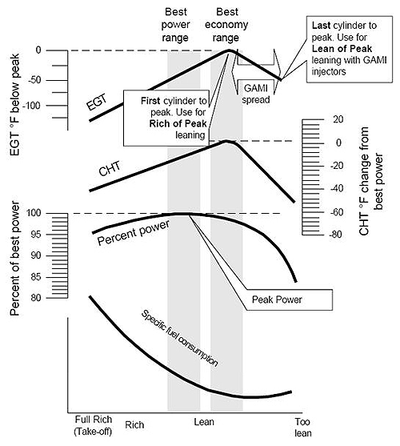
WARNING: Cancer and Reproductive Harm - www.P65Warnings.ca.gov. |
Features
- Hands-free, automatic scanning
- All programming done from the Front Panel
- LeanFind finds the first and last cylinder to peak with true peak detect eliminates false peaks
- Displays both leaned temperature below peak and peak
- Battery voltage with alarm
- Amperes (load or charge/discharge meter)
- Programmable alarm limits
- Normalize view
- Exhaust Gas Temperatures (EGTs) to stable 1°F resolution
- DIF low to high EGT with alarm
- EGTs to stable 1°F resolution
- Shock cooling monitored on every cylinder
- Shock cooling monitored on every cylinder
- User selectable index rate
- Fast response probes
- Non-volatile long term memory
- Records and stores data up to 30 hours
- Post-flight data retrieval
- Download to Palm Computer
- Data retrieval software
- Oil pressure
- Oil temperature
- Outside air temperature
- Fuel level
- Fuel Flow
- Solid-state rotor fuel flow transducer
- Fuel quantity in gallons, kilograms, liters, or pounds
- Low fuel quantity alarm
- Low fuel time alarm
- GPS interface
- Instantaneous fuel flow rate
- Total amount of fuel consumed
- Total fuel remaining
- Time to empty at the curent fuel flow rate
- RPM and manifold pressure
- Automatically calculates percent horsepower
- History of extreme values during previous flight
- Hobbs® timer
Videos


Reviews
I have been running a 930 in my Debonair for a few years now and love the size and functionality of the unit. The ability to use data driven diagnostics is outstanding.. This was the driving factor around my whole panel build.
The unit has lots of information, it takes a little time to get used to. Easy to see in all light conditions. One drawback is that with this unit being considered a primary instrument the user cannot make changes. I have the 930 installed to monitor a Continental engine. The CHT alarm is set for 460 degrees F. The alarm should be 80 F lower but because it is in the POH it cannot be changed. I have had multiple problems and while JPI and the dealer have been responsive the issues are a nuisance and can get expensive in flying to the dealer. First I had a situation while in flight when the entire unit shut down. Next the MP quit working while in flight on multiple flights, then the amp readings became erratic. The latest is the RPM failed, the tach time became inaccurate and the aircraft ID partially failed. The remote display continues to be intermittent. Currently a loaner 930 is on the way to try to isolate the problem. Hopefully this will lead to discovering what fix is needed.
Installed a couple EI units before, decided on JPI this time. Wish I hadnt. Seem like good units, but manual isnt as clear as EI and you need to buy many more parts you wont know about until you install and ask JPI questions. Example is you need two one amp fuses and holders on the shunt lines, which dont come with the unit. Its tough to know what all you need before hand unless youve installed a couple before. My next install will be an EI.
Q&A
Please note, Aircraft Spruce ®'s personnel are not certified aircraft mechanics and can only provide general support and ideas, which should not be relied upon or implemented in lieu of consulting an A&P or other qualified technician. Aircraft Spruce ® assumes no responsibility or liability for any issue or problem which may arise from any repair, modification or other work done from this knowledge base. Any product eligibility information provided here is based on general application guides and we recommend always referring to your specific aircraft parts manual, the parts manufacturer or consulting with a qualified mechanic.
The only difference between the EDM 900 and the EDM 930 is that the EDM 930 has a larger display. Other than that, they are essentially the same.
The screen has a panel cutout size of 5.5" X 4.7".
The memory size is 100 hrs which can be transferred via USB drive.
Yes, fuel flow and CHT/EGT are included. The different versions are for the amount of fuel tanks in your system. Everything required for installation is included.
AML has been added to our webpage. Please download and review it there.
Per the manufacturer: It is recommended to use the new probes included with the kit.
You will need to use the new JPI probes that are included in the EDM package.
No, JPI does not offer an upgrade from 830 to 930.
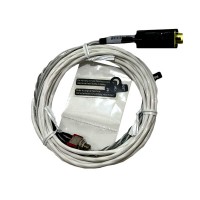
Yes, the JPI EDM-930 wiring harness and probes can be purchased separately from the main display unit. While the system is typically sold as a complete, all-in-one package (including the display, harness, and probes), JPI allows for the purchase of individual harness components, probes (EGT, CHT, TIT, OAT), and transducers (Oil Pressure, Fuel Pressure, RPM) as replacement or expansion parts.
No, JPI only sells this as a full kit.